
The results are in! First NVES scores show strong industry surplus as BYD stars and Mazda flunks
The first performance results under Australia’s New Vehicle Efficiency Standard (NVES) show the automotive industry collectively exceeded its 2025 emissions targets, generating a sizeable surplus of tradeable credits.
But the data has also produced definite winners and losers and intensified debate over how aggressively the scheme should tighten in coming years.
Figures released by the NVES Regulator today covering the July to December 2025 performance period show 59 regulated entities reported 620,947 covered vehicles.
READ MORE: Kia Sorento PHEV and hybrid range expands dramatically in Australia: NVES drives electrification for popular Toyota Kluger rival
READ MORE: “I just don’t think the Australian market wants an EV,” Australian boss of major car company slams EVs and NVES – but is he right?
READ MORE: Audi reveals big NVES impact: Cheapest Aussie PHEV has been priced to woo buyers from in-house ICE rival!
Around 68 per cent of suppliers beat their emissions targets, generating 17.2 million NVES Interim Emissions Value (IEV) units and leaving a potential net surplus of approximately 15.9 million units that can be banked or traded into future compliance years.
The NVES is intended to stimulate the import and sale of low and zero emissions vehicles and it works by setting an annual fleet-average CO₂ emissions target for each vehicle supplier based on the vehicles it brings into Australia.
Each manufacturer’s average is calculated by multiplying the certified CO₂ output of each model by the number of vehicles supplied, then averaging the result across its entire fleet for the reporting period.
If a brand’s fleet emissions come in below its target, it earns NVES credits. Those credits can be banked for future years or traded to other suppliers that exceed their targets.
If a manufacturer finishes a compliance period above its emissions target and does not offset the shortfall with purchased or banked credits, civil penalties apply at a legislated rate of $50 per unit.
Formal reconciliation is not required until 2028, giving suppliers time to adjust their product line-up and/or participate in the emerging credit market.
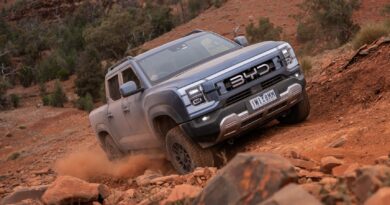
Among the strongest performers in the first period were BYD, Tesla and Toyota. BYD entities together accrued more than six million units, Toyota generated around 2.9 million units and Tesla about 2.2 million.
However, several mainstream brands recorded interim liabilities. Mazda accrued 508,517 units during the reporting period and Nissan more than 215,000.
At the $50 per unit penalty rate, Mazda’s interim position would equate to more than $25 million if settled immediately, although that figure could change substantially as trading and future supply adjustments occur before reconciliation.
And also bear in mind, it’s not the number of cars a maker sells that determines their score, it’s how many they import.
This is a loophole in the NVES the federal government is intending to amend so calculations are based on sales.
According to the regulator, average emissions across both passenger and light commercial vehicle categories came in below statutory targets. Passenger vehicles averaged 114g/km against a target of roughly 144g/km, while light commercial vehicles averaged 199g/km against a target of about 214g/km.
Electric vehicles accounted for approximately 12 per cent of vehicles covered under the NVES during the reporting period, with the remainder internal combustion or hybrid models.
Federal Infrastructure Minister Catherine King said the early results demonstrated the reform was delivering its intended outcomes.
“These first NVES results show that cleaner vehicles and a competitive market can go hand in hand,” she said.
“Australians continue to have a choice across a wide variety of vehicles. These results make it clear the NVES supports both lower emissions and consumer affordability.”
The Federal Chamber of Automotive Industries acknowledged the industry had met its first-year targets but warned compliance becomes significantly more challenging as the trajectory tightens.
The NVES target for passenger vehicles in 2026 is 17 per cent lower than 2025 levels, and 14 per cent lower for light commercial vehicles.
By 2029, passenger vehicle targets will be 59 per cent lower than 2025 and light commercial vehicle targets 48 per cent lower.
FCAI chief executive Tony Weber said sustaining compliance would require materially stronger EV uptake than current trends indicate, noting electric vehicles represented 8.3 per cent of total new vehicle sales in 2025.
He also warned that additional compliance costs generated under the NVES would likely be passed on to consumers.
The Electric Vehicle Council said the results demonstrated the reform was working as designed and argued policymakers should maintain confidence in the scheme’s tightening trajectory. It also suggested that allowing large volumes of banked credits to dampen future ambition would be counter-productive.
The managing director of EV brand Polestar Australia, Scott Maynard, said the fact two-thirds of suppliers exceeded their targets showed the standards were achievable despite criticism from some parts of the industry.
“The New Vehicle Efficiency Standard is already driving change for Australians, helping deliver more zero- and low-emissions options to new car buyers,” he said.
“The fact two-thirds of manufacturers beat their emissions targets proves these regulations are achievable.”
Mr Maynard said the next phase of NVES, combined with incentives such as the Fringe Benefits Tax exemption for electric vehicles, would remain important in progressing towards long-term emissions reduction targets.
The National Automotive Leasing and Salary Packaging Association similarly argued the results reinforced the need to maintain demand-side support mechanisms, particularly the Electric Car Discount delivered through novated leasing arrangements.
NALSPA chief executive Rohan Martin said the NVES was influencing manufacturer behaviour but the EV market was not yet self-sustaining.
“With electric vehicles representing around 12 per cent of cars covered by the NVES in 2025, it’s still very early days of the EV transition,” he said.
“The NVES provides supply and the Electric Car Discount encourages demand.”
Industry consultant Matt Hobbs cautioned that year-one outperformance should not be interpreted as evidence the pathway ahead will be smooth.
“Multi-million-dollar penalties in year one of a deliberately soft start should be a wake-up call,” he said.
“The NVES gets significantly harder from 2027. What looks like a decent result today can turn into a serious compliance and financial problem very quickly.”
Hobbs said tightening light commercial vehicle targets would particularly challenge brands heavily reliant on diesel utes unless viable plug-in hybrid or electric alternatives are introduced at scale.
“Year one was the easy year,” he said. “The scoreboard will look very different from 2027.”
The NVES Performance Table, July-December 2025*
| Regulated entity | Number of covered vehicles | IEV | Units generated | Liabilities accrued |
|---|---|---|---|---|
| Alfa Romeo SpA | 62 | 2,580 | 0 | 2,580 |
| Anhui Jianghuai Automobile Group Corp., Ltd/ JAC MOTORS | 252 | -2,185 | 2,185 | 0 |
| Aston Martin Lagonda Limited | 105 | 13,877 | 0 | 13,877 |
| Audi AG | 8,050 | -21,780 | 21,780 | 0 |
| Automobili Lamborghini S.P.A. | 67 | -1,594 | 1,594 | 0 |
| B M W AUSTRALIA LTD. | 15,445 | -340,081 | 340,081 | 0 |
| Beiqi Foton Motor Co. Ltd. | 497 | -2,941 | 2,941 | 0 |
| BENTHAM, VINCENT MARK | 2 | 138 | 0 | 138 |
| Bentley Motors Limited | 81 | -1,875 | 1,875 | 0 |
| BYD AUTO CO. LTD | 26,129 | -4,234,294 | 4,234,294 | 0 |
| BYD AUTO INDUSTRY COMPANY LIMITED | 13,474 | -2,048,530 | 2,048,530 | 0 |
| Chery Automobile Co., Ltd | 30,829 | -438,633 | 438,633 | 0 |
| Chongqing Changan Automobile Co., Ltd. | 383 | -65,540 | 65,540 | 0 |
| DONGFENG LIUZHOU MOTOR CO., LTD. | 2 | -291 | 291 | 0 |
| Dr. Ing. h.c. F. Porsche Aktiengesellschaft | 1,653 | 33,448 | 0 | 33,448 |
| FCA USA LLC | 283 | 8,194 | 0 | 8,194 |
| Ferrari S.p.A. | 108 | 15,785 | 0 | 15,785 |
| Ford Motor Company | 355 | -1,079 | 1,079 | 0 |
| FORD MOTOR COMPANY OF AUSTRALIA PTY LTD | 38,541 | -426,261 | 426,261 | 0 |
| Ford Werke GmbH | 1,169 | -24,559 | 24,559 | 0 |
| GAC International Co., Ltd. | 406 | -34,260 | 34,260 | 0 |
| GENERAL MOTORS AUSTRALIA AND NEW ZEALAND PTY LTD | 1,552 | 65,855 | 0 | 65,855 |
| Great Wall Motor Company Limited | 29,660 | -405,198 | 405,198 | 0 |
| Guangzhou Xiaopeng Motors Technology Co. Ltd | 1,000 | -165,995 | 165,995 | 0 |
| Honda Motor Company Limited | 9,022 | 26,069 | 0 | 26,069 |
| Hyundai Motor Company | 39,863 | 84,563 | 0 | 84,563 |
| Isuzu Motors Limited | 29,825 | -365,080 | 365,080 | 0 |
| JAGUAR LAND ROVER AUSTRALIA PTY LTD | 3,355 | 16,666 | 0 | 16,666 |
| JAGUAR LAND ROVER LIMITED | 25 | 1,819 | 0 | 1,819 |
| KG Mobility Corp. | 1,969 | 22,344 | 0 | 22,344 |
| Kia Motors Corporation | 51,732 | -729,698 | 729,698 | 0 |
| MAHINDRA AUTOMOTIVE AUSTRALIA PTY LTD | 2,757 | 32,938 | 0 | 32,938 |
| MASERATI S.P.A. | 96 | 4,496 | 0 | 4,496 |
| Mazda Motor Corporation | 38,465 | 508,517 | 0 | 508,517 |
| McLaren Automotive Ltd | 21 | -416 | 416 | 0 |
| MERCEDES-BENZ AUSTRALIA/PACIFIC PTY LTD | 11,494 | -133,730 | 133,730 | 0 |
| MITSUBISHI MOTORS AUSTRALIA LIMITED | 35,002 | -82,072 | 82,072 | 0 |
| NISSAN MOTOR CO. (AUSTRALIA) PTY. LTD. | 13,877 | 215,261 | 0 | 215,261 |
| Polestar Performance AB | 1,639 | -281,410 | 281,410 | 0 |
| Renault s.a.s | 903 | -16,310 | 16,310 | 0 |
| Rolls-Royce Motor Cars Limited | 34 | 4,497 | 0 | 4,497 |
| SAIC MAXUS Automotive Co., Ltd | 5,519 | 21,129 | 0 | 21,129 |
| SAIC Motor Corporation Limited | 26,991 | -377,601 | 377,601 | 0 |
| SEAT, S.A. | 823 | -67,733 | 67,733 | 0 |
| Shandong Tangjun Ouling Automobile Manufacture Co., Ltd. | 46 | -9,837 | 9,837 | 0 |
| SKODA AUTO a.s. | 2,914 | -86,888 | 86,888 | 0 |
| Smart Automobile Co., Ltd. | 2 | -303 | 303 | 0 |
| STELLANTIS (AUSTRALIA AND NEW ZEALAND) PTY LTD | 336 | -50,466 | 50,466 | 0 |
| Stellantis Auto SAS | 681 | -23,730 | 23,730 | 0 |
| STELLANTIS EUROPE S.P.A | 158 | -9,615 | 9,615 | 0 |
| Subaru Corporation | 13,187 | 139,635 | 0 | 139,635 |
| Suzuki Motor Corporation | 5,042 | -64,204 | 64,204 | 0 |
| Tesla, Inc. | 13,907 | -2,212,093 | 2,212,093 | 0 |
| TOYOTA MOTOR CORPORATION AUSTRALIA LIMITED | 115,504 | -2,890,625 | 2,890,625 | 0 |
| Volkswagen AG | 15,876 | -510,249 | 510,249 | 0 |
| Volvo Car Corporation | 3,643 | -158,781 | 158,781 | 0 |
| Wuhan Lotus Cars Co., Ltd. | 1 | -173 | 173 | 0 |
| Zheijiang Zeekr Intelligent Technology Co., Ltd | 1,503 | -259,440 | 259,440 | 0 |
| Zhejiang Geely Automobile Co., Ltd. | 4,630 | -620,233 | 620,233 | 0 |
| Total | 620,947 | -15,942,972 | 17,165,783 | 1,222,811 |
*How to read this table
If an entity has an interim emissions value (IEV) below zero, this means they have beaten their target. These entities accrue NVES units for the 2025 performance period.
If an entity has an IEV above zero, this means they have not beaten their target. These entities accrue NVES liabilities for 2025.